Quality of a Database and Questionnaires
Quality Analysis of Questions and Test Reliability
Each time a person answers a question, we obtain information about the person's knowledge (which is generally what interests us most), but we also obtain information regarding the question itself. For example, is it an easy question (answered correctly by many participants) or a difficult one (answered correctly by few participants)?
But there are many other possible analyses, which are very important.
Let’s talk about correlation. Generally speaking, if we have a set of questions on a particular subject, let’s say GDPR, we expect that “the more a person knows GDPR well, the more they answer each question correctly.” This seems very simple and almost obvious. If I consider a specific question from my database, let’s say question #23, I expect that “the higher a person’s overall score, the better they will do on question #23 as well.” This is not systematic: it is possible for a highly knowledgeable person to fail this question. But generally speaking, the probability of success on question #23 correlates with the probability of success on the overall test.
If we have enough data, this correlation can be measured mathematically, and we can then ask whether each question is well correlated with the overall database. This correlation is a good measure of the quality of the question, that is, its ability to contribute to measuring knowledge on that topic.
From this type of analysis, it is possible to calculate the coefficient “Cronbach's Alpha”, which is a generalization of the Kuder-Richardson coefficient, known as KR-20. Schematically, one can say that it is a measure of the overall quality of the question set; in other words: the higher this coefficient, the more reliable the tests using these questions will be. In general, we aim for a KR20 above 70%, and it is common to achieve values above 90%.
A KR20 value below 70% is not satisfactory, meaning that your tests will not have sufficient reliability. What can be done about it? It’s quite easy actually: simply look for questions that have a low correlation, and either improve them or, even more simply, remove them.
Questions that have a negative correlation with the overall database must indeed be corrected or removed: these are questions such as “the more a person has a good grasp of the knowledge on this topic, the less they find the correct answer to this question.” In other words, the question is likely either poorly formulated or simply incorrect (the correct answer is not the one given; experts know the correct answer, hence they fail).
From the KR20 value, it is possible to determine the standard error, that is, the margin of error associated with the results obtained from a test using these questions.
Even with excellent questions, it is common for the standard error to be around 5%, or approximately ±1 point on a score of 20. This indicator is crucial: if your standard error is 15%, for example, a score of 15/20 must actually be interpreted as falling between 12/20 and 18/20. The level of imprecision then becomes concerning.
Note that the standard error depends both on the KR20 and the number of questions in the test. The more questions the test includes, the smaller the standard error will be.
That’s why this indicator is particularly relevant at the level of a given questionnaire, rather than at the scale of a complete database of questions.
Keep this in mind: quality statistical analyses involve somewhat complex calculations, but you don’t need to worry about them; just look at the results and recommendations presented to you.
Also check out our article dedicated to the reliability of assessments.
Main Indicators
These analyses have been available on the Experquiz platform for years, but they have been significantly improved and made more efficient in this version.
To access the quality analyses, you first need to enable this feature in your company settings (Tab “Settings,” section “Databases”).

At each of your question databases, you then have a tab “Quality” that looks like this:

You have the following filters:
- Either all questionnaires or only one specific questionnaire from the database.
- You can choose a specific test context, for example, if you think that results from an evaluation are more relevant than results from open tests.
- You can select a specific time period to consider only the results from that interval.
The page then presents a table of indicators, and for each indicator, a colored dot indicating the extent to which the value is satisfactory, along with a detailed comment accompanied by recommendations.
If your sample (the tests corresponding to your filters) consists of fewer than 40 users, a warning is displayed at the top of the page, alerting you to the reliability of the analyses. This type of analysis is really only relevant if more than 40 users have answered your questions.
The indicators are as follows:
- Cronbach's Alpha / KR20: see the explanation in the previous chapter.
- Standard Error: see the explanation in the previous chapter. It is worth noting that it really only makes sense for a given questionnaire.
- Number of Questions: for reliable scores, your tests need to include a sufficient number of questions, ideally at least 30 questions. For tests with fewer than 20 questions, the variances are higher, and the standard error will be larger.
- Number of Users: as stated in the introduction, these analyses require at least 40 users.
- Overall Average of Questions: it is considered that an average success rate around 60 to 70% is ideal to combine motivation (the participant is motivated by their successes) and selectivity (not all participants succeed on all questions). However, this indicator is not critically important.
- Questions with a success rate below 20%
- Questions with a success rate above 80%
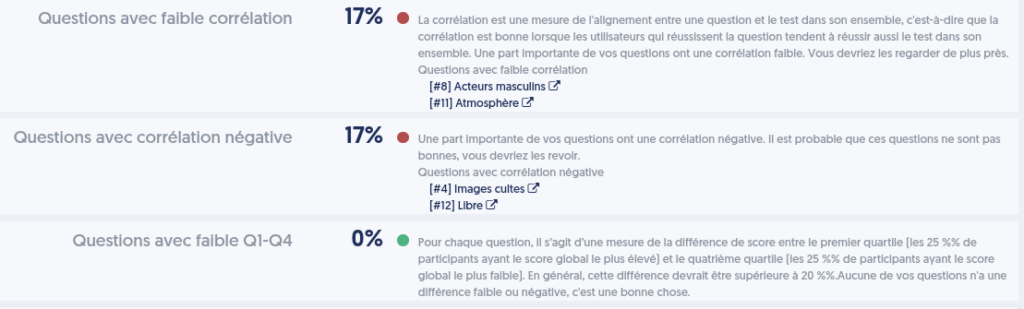
- Questions with low correlation: see above for the explanation of the concept of correlation. A question with low correlation is one such that “the most experienced participants do not answer this question better than the weaker participants.” The question may not be wrong, but it does not seem to measure the same knowledge as the other questions.
- Questions with negative correlation: as discussed earlier, negative correlation questions are indeed a concern, and it is essential to address them since they degrade the quality of your tests.
- Questions with low Q1-Q4: this refers to a notion that resembles correlation but is calculated a bit differently.
For these last three indicators, the table presents the complete list of the concerned questions, with a link allowing you to modify the question in a new tab.
The Graphs
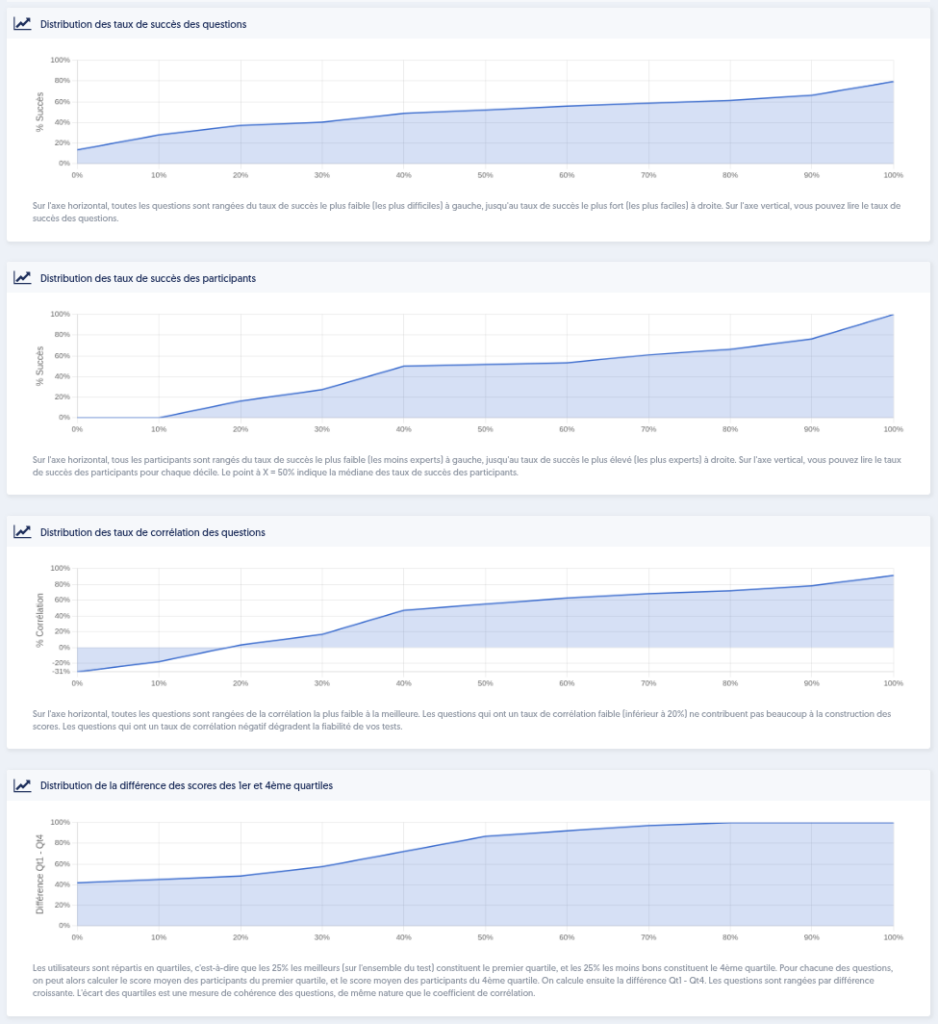
The next section of the page presents 4 graphs:
- The distribution of the success rates of questions: on the horizontal axis, all questions are arranged from the lowest success rate (the most difficult) on the left to the highest success rate (the easiest) on the right. On the vertical axis, you can read the success rate of the questions. Ideally, it’s a curve that could be a straight line leading from 0% on the left to 100% on the right. There isn’t really a bad configuration, but if, for example, the curve reaches 100% halfway, meaning that half of your questions have a success rate of 100%, it likely indicates that there are not enough more challenging questions, as all these questions that everyone succeeds in do not contribute much to your scores.
- The distribution of the success rates of participants: on the horizontal axis, all participants are arranged from the lowest success rate (the least skilled) on the left to the highest success rate (the most skilled) on the right. On the vertical axis, you can read the success rate of participants for each decile. The point at X = 50% indicates the median of the success rates of participants.
- The distribution of the correlation rates of questions: on the horizontal axis, all questions are arranged from the lowest correlation to the highest. Questions with a low correlation rate (below 20%) contribute little to the score construction. Questions with a negative correlation degrade the reliability of your tests. In the image below, we can see that some questions have a negative correlation.
- The distribution of the score difference between the 1st and 4th quartiles: users are divided into quartiles, meaning the top 25% (across the entire test) make up the first quartile, and the bottom 25% make up the fourth quartile. For each question, we can then calculate the average score of participants in the first quartile and the average score of participants in the fourth quartile. We then calculate the difference Q1 – Q4. The difference between quartiles is a measure of the consistency of questions, akin to the correlation coefficient.
Correlation Matrix and Question Clusters
At the bottom of the page, you will find the complete correlation matrix, which shows, in the form of small colored squares, the correlation between each pair of questions in the database.
Green, colored squares represent pairs of questions that have a positive correlation. This means that if people succeed in the first question, they are likely to also succeed in the second. The darker the green color, the stronger the correlation.
Conversely, red squares represent pairs of questions that have a negative correlation: when one succeeds on the first question, it is likely that one will fail on the second.
Based on these correlations, one can subsequently build clusters of questions that are correlated with each other. When a person succeeds in one of the questions from the cluster, it is likely (very likely or somewhat likely) that they will also succeed in the other questions of the cluster.
This should not lead one to think that the questions in the cluster are equal and that just one of them would suffice. First, correlation does not prove that the knowledge being measured is the same, and secondly, it is always good to approach a concept from different angles, with a variety of questions.
Action Buttons
At the top of this quality page, you have two action buttons. They are only active if the sample includes enough participants to allow for satisfactory analyses.
- the button ASSIGN QUALITY INFO: this button attaches the calculated information here to each question in the database. This information can then be viewed in the list of questions in the database by choosing the "quality view.” Thus, you will have the average success rate for each question, its correlation with the overall database, and the difference between the first and fourth quartiles.

- the button REASSIGN LEVELS: this button allows you to redefine the difficulty level of each question in the database. Questions are arranged from easiest (highest success rate) to hardest (lowest success rate), with the easiest 20% of questions receiving a value of 1 for their level. The next 20% will have the value 2. And so on up to the hardest 20%, which will have the value 5.
This is a very useful tool for assigning a reliable difficulty level. Indeed, contributors cannot determine with certainty whether a question is difficulty level 2 or level 3. With this functionality, you have a measure of difficulty based on your users' responses.