Survey Results
You have access to a Results tab, which provides access to all the data collected through this survey form.
The survey results offer extensive analysis capabilities, including:
- Enhanced multi-criteria filtering.
- PDF export of an individual respondent's answers.
- Comprehensive statistics.
- A new customizable export containing consolidated results from a selected set of survey responses.
Multi-Criteria Access to Results
From the Results tab of a survey, you can list all submitted responses with numerous filtering options:
- Search for a specific respondent by last name, first name, etc.
- Filter by a specific user group.
- Filter by the survey completion context.
- Filter by a specific time period.
- Filter by status, representing the completion state of the response.
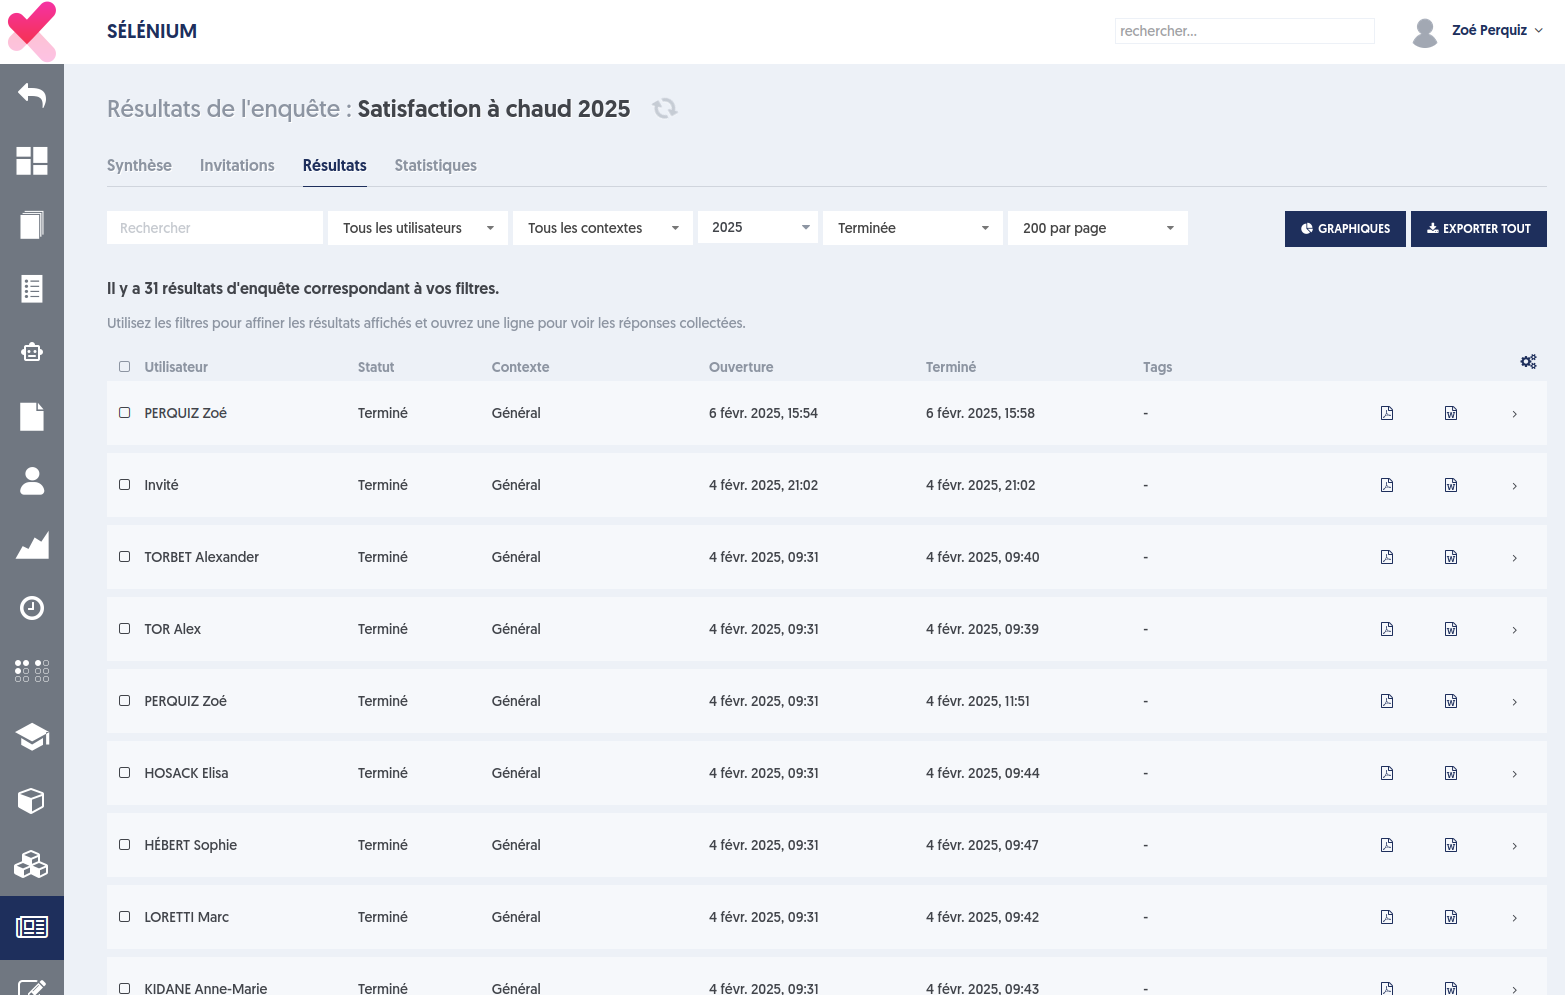
On this page, each response row provides two export buttons:
- PDF Export: a new export format.
- Word Export (DOCX): the existing export format already available.
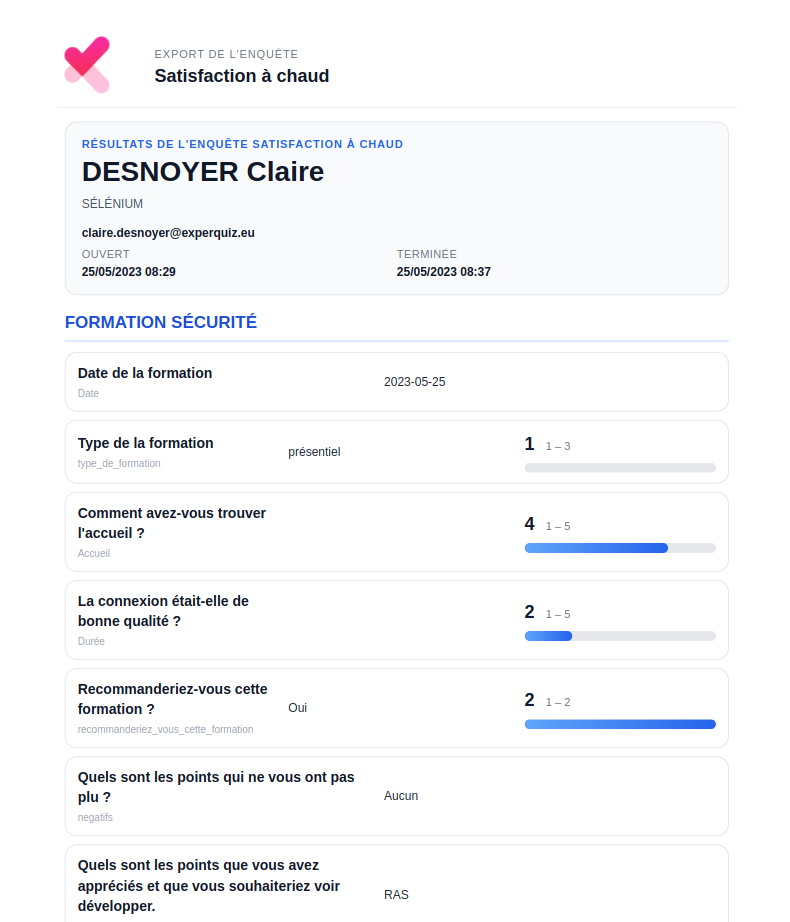
The PDF export looks like this:
Exporting Multiple Results
From this page, you can also export a selection of survey results.
- Select the response rows you want to export using the checkboxes on the right.
- At the top of the page, two export buttons are available: Export and PDF Export.
- The Export button generates an Excel file containing one row per respondent, with each survey answer displayed in a separate column.
- The PDF Export button generates a single PDF document containing the responses of each selected respondent, using the format shown above.
Accessing Statistics
There are two ways to view statistics for survey results:
- Statistics for all responses matching the currently applied filters. Simply click the Statistics tab located next to the Results tab. An important point to note is that filters are synchronized between these two tabs. All filter settings (group, period, context, etc.) remain active when switching tabs.
- Statistics for a specific selection of responses. Select the desired response rows using the checkboxes, then click the Charts button. The application switches to the Statistics tab without displaying the filters, and a message at the top of the page reminds you that "These statistics correspond to the 15 survey results selected from the Results page."
Available Survey Statistics
The Statistics tab displays the following information.
An Overview Matching the Survey Structure
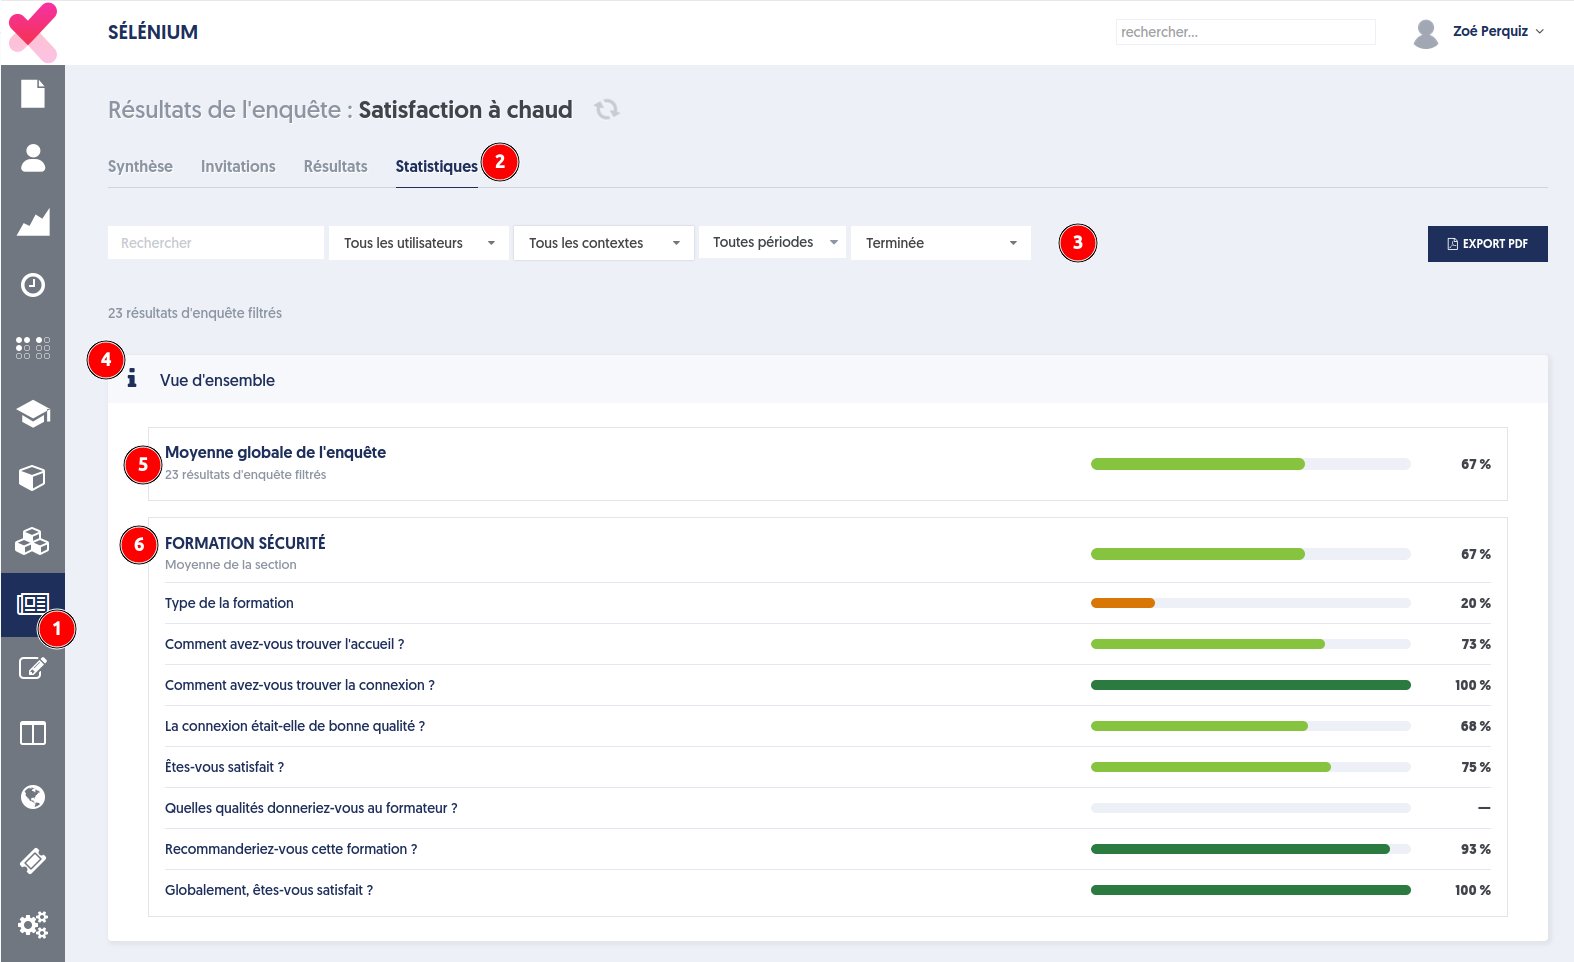
In this screenshot, we have highlighted:
- (1) the Surveys section in the main menu.
- (2) the Statistics tab.
- (3) the available filters used to refine the selection.
- (4) the first statistics panel, Overview.
- (5) the overall average of all quantitative responses for respondents matching the current filters, across all survey fields.
- (6) the first survey section (if sections are used), showing both the average for the entire section and the details for each field within it.
Keep in mind that not every input field can produce quantitative measurements. For selector-type fields, you must enable the Convert to Number option so that labels such as Good or Very Good can be interpreted numerically.
Let's scroll further down the Statistics page.
The Second Panel Displays Score Trends Over Time
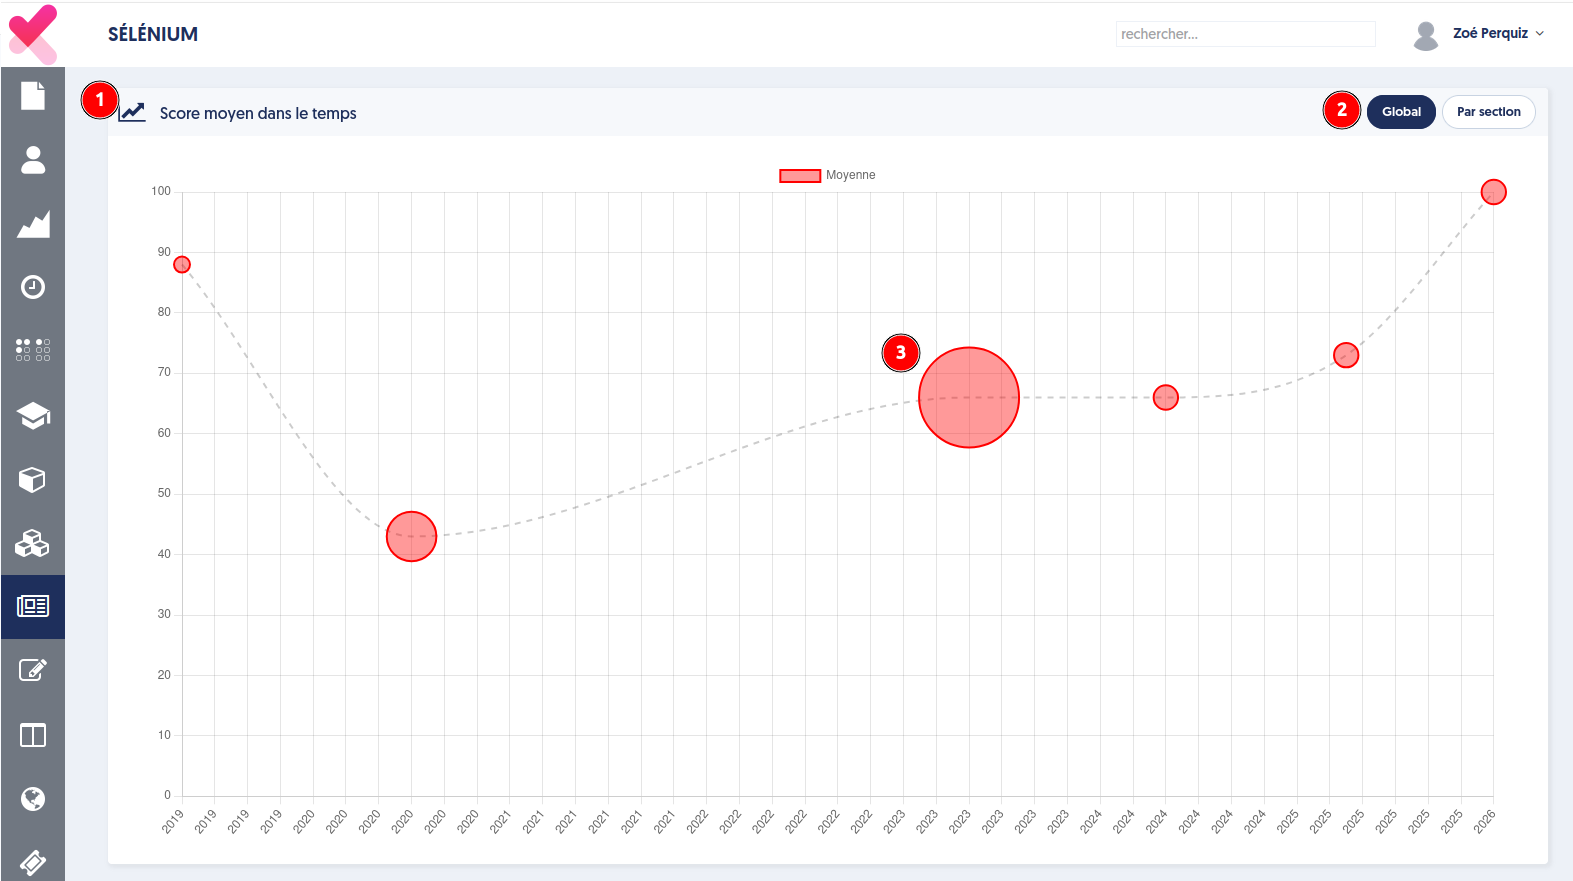
Here we have highlighted:
- (1) the Average Score Over Time panel.
- (2) the selector allowing you to display either the overall average across all survey fields or a breakdown by survey section. Sections represent subsets of the survey fields.
As before, your survey must contain at least some numeric fields or selector fields converted to numeric values.
The Charts Panel
Further down, you'll find the Charts panel, which displays the distribution of responses for each available choice.
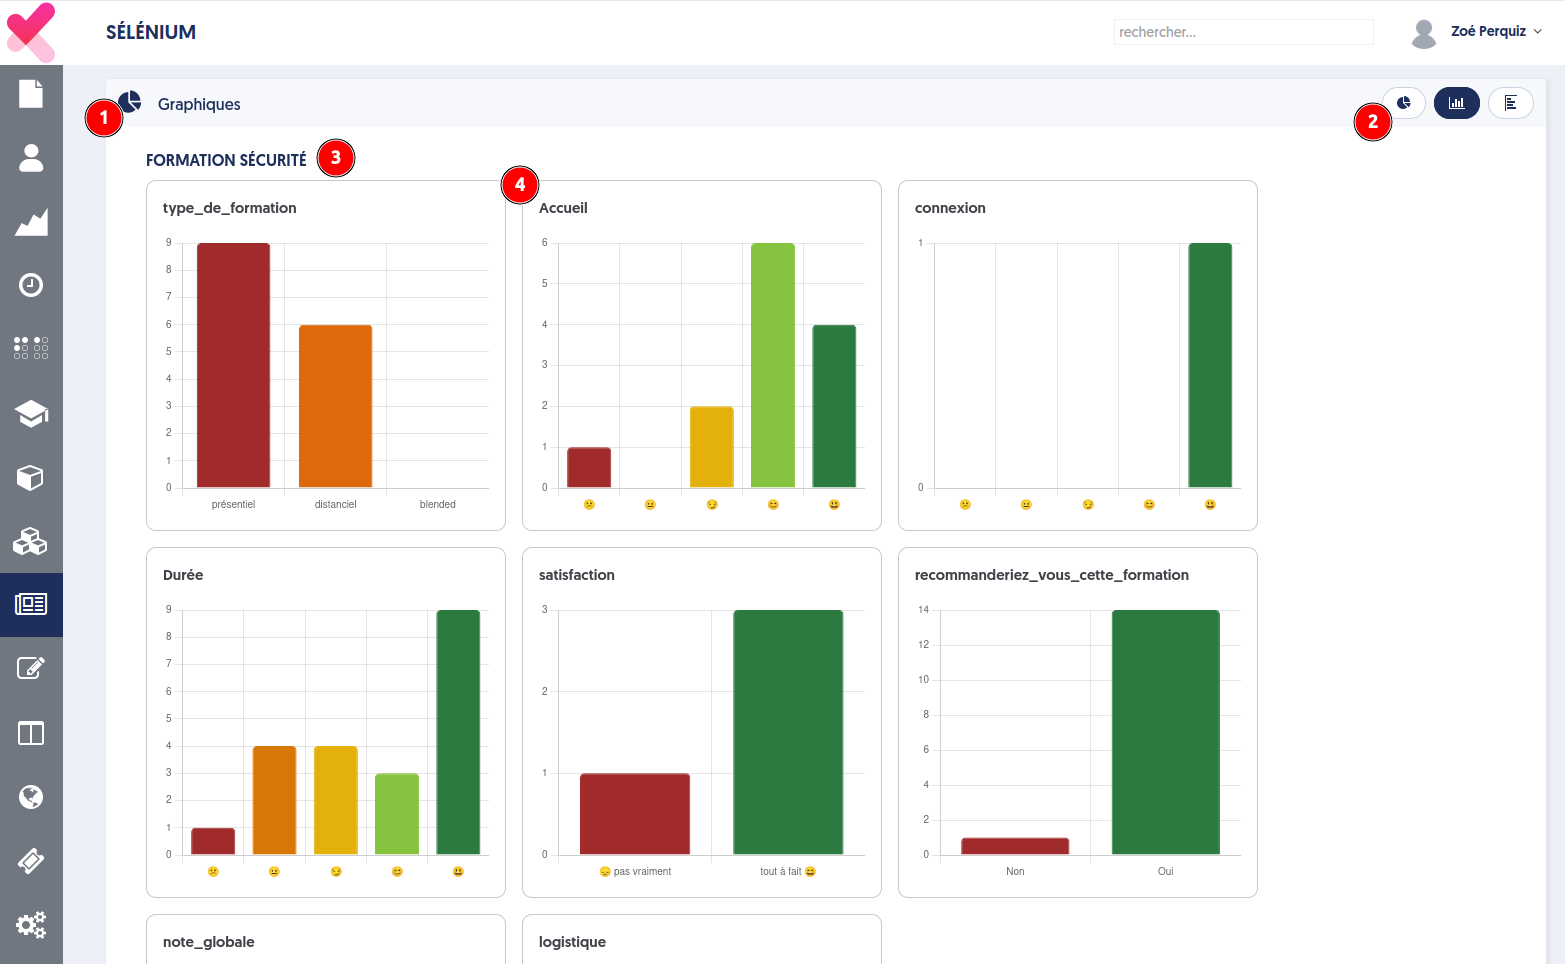
In this screenshot:
- (1) the panel title.
- (2) the chart type selector. You can choose between three formats: (a) pie chart, (b) vertical bar chart, or (c) horizontal bar chart.
- (3) if your survey uses sections, the first section of the survey.
- (4) for each field within the section (where applicable), the corresponding chart.
Detailed Response Table
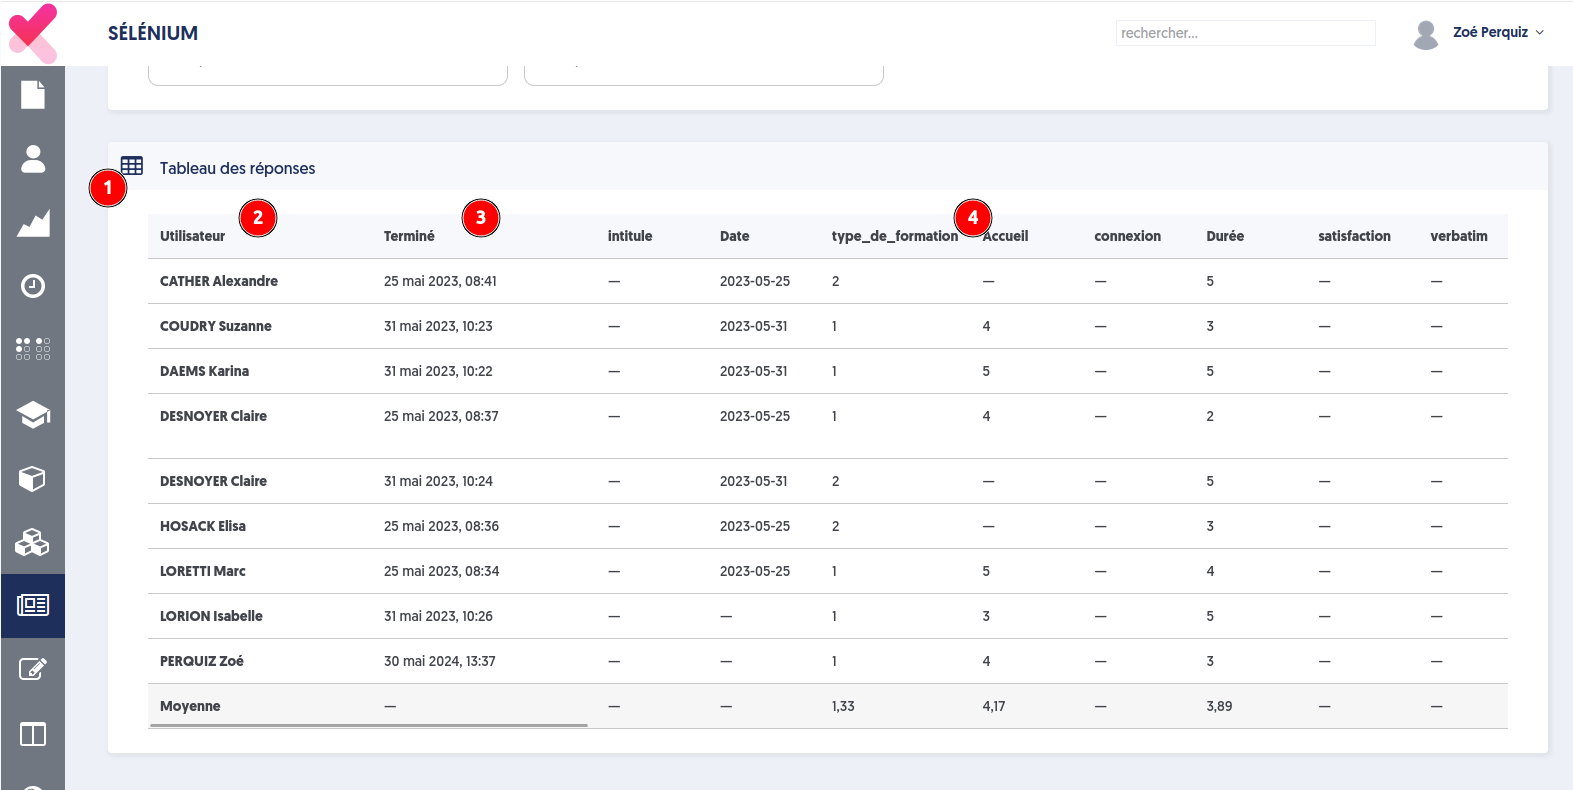
This section is displayed only when working with an explicit selection of responses, not when statistics are generated from a filtered set of responses.
In the screenshot, we have highlighted:
- (1) the panel title.
- (2) the first and last name of each respondent.
- (3) the date on which they completed the survey.
- (4) one column for each field in the survey.
Unlike the previous statistics, every survey field is displayed here, whether it contains numeric values or not.
Exporting Statistics to PDF
You can export all the information displayed on the Statistics page as a PDF document by clicking the PDF Export button located at the top of the page.
A panel opens on the right, allowing you to configure the PDF output.
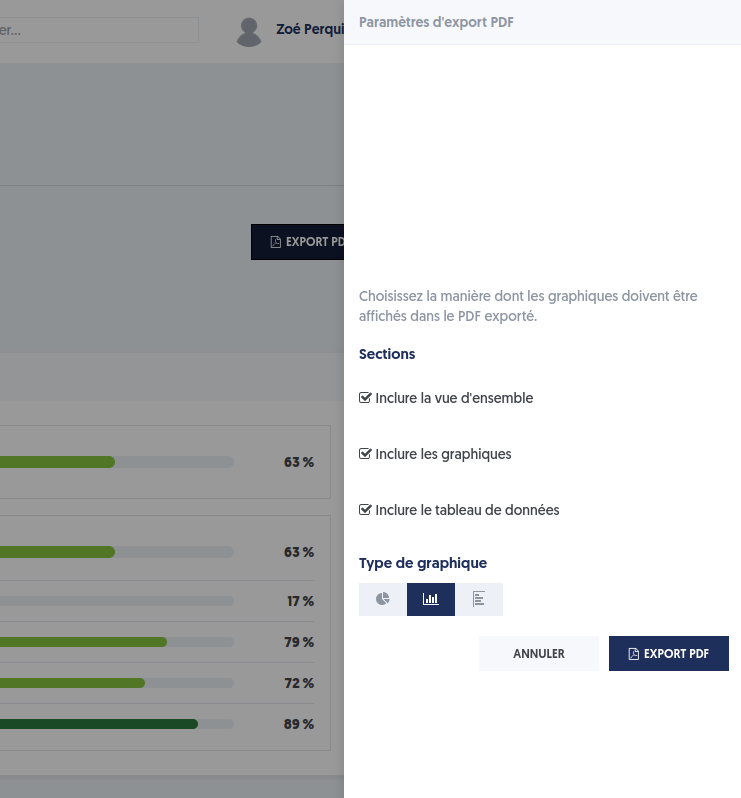
You can specify:
- Which sections of the document you want to include.
- The chart type used for the response distribution by field.
As with all Experquiz exports, the document may either be generated immediately if it is small enough or processed as a background task and made available after a few minutes.
You can access all generated exports by going to Settings, then the Administration tab, and finally the Background Tasks sub-tab.