Evaluation Results History
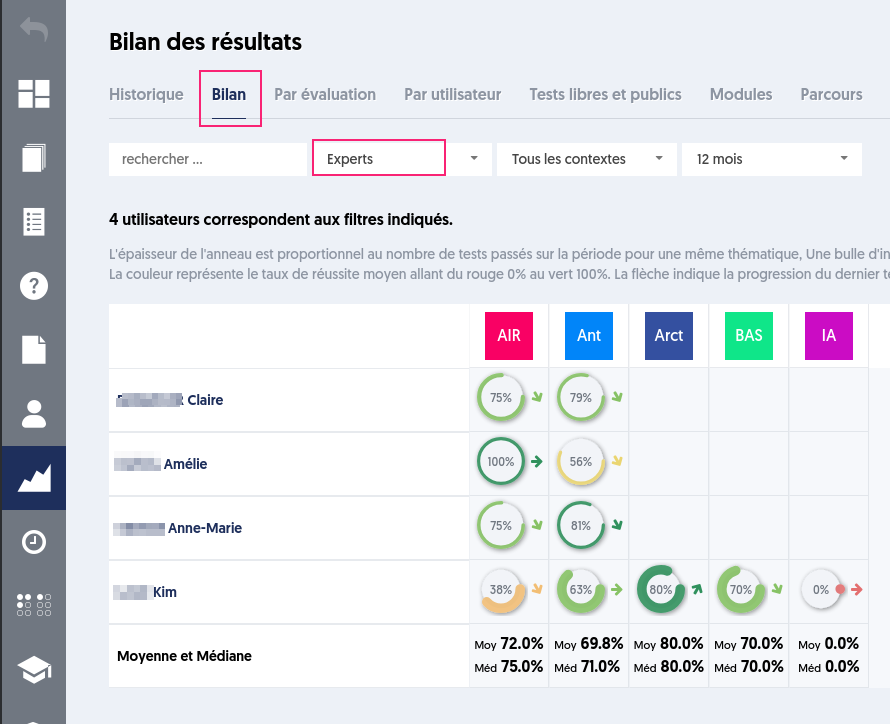
To track the progress of user groups on various topics, there is a summary page per user that shows the average and the number of evaluations over a given period.
A summary is provided to display the history of evaluations and thus track the activity and results over time.
Note that this new "history" tab is now the first on the results page, while the summary tab, by user and by database, has been renamed "summary" and appears in second position in the tab bar.
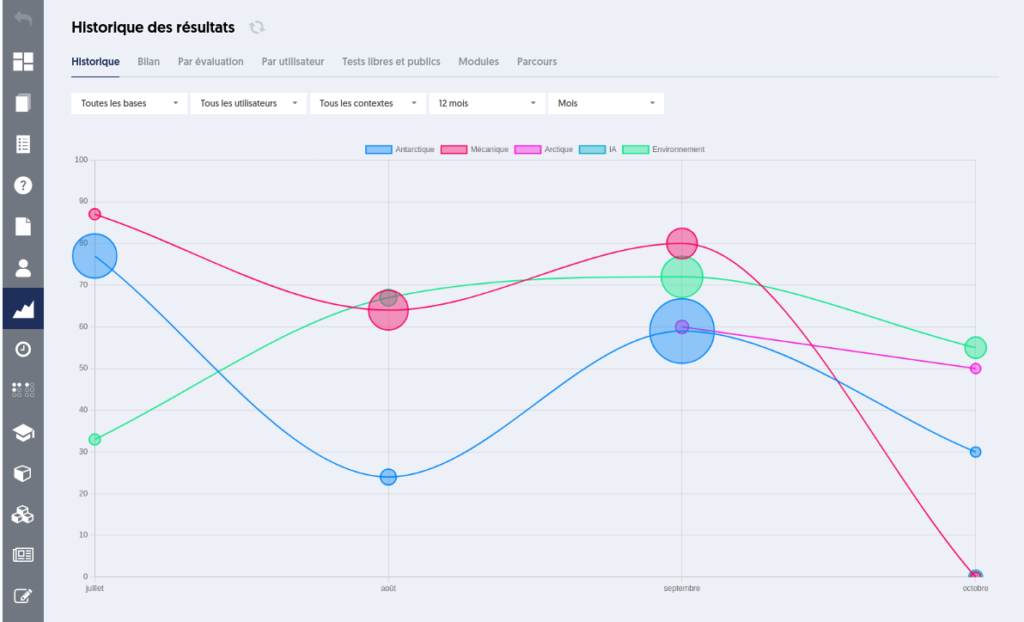
The filters allow you to select:
- The thematic databases
- The user groups
- The context (evaluation, certification, or open test)
- The period
- The granularity (week, month, year)
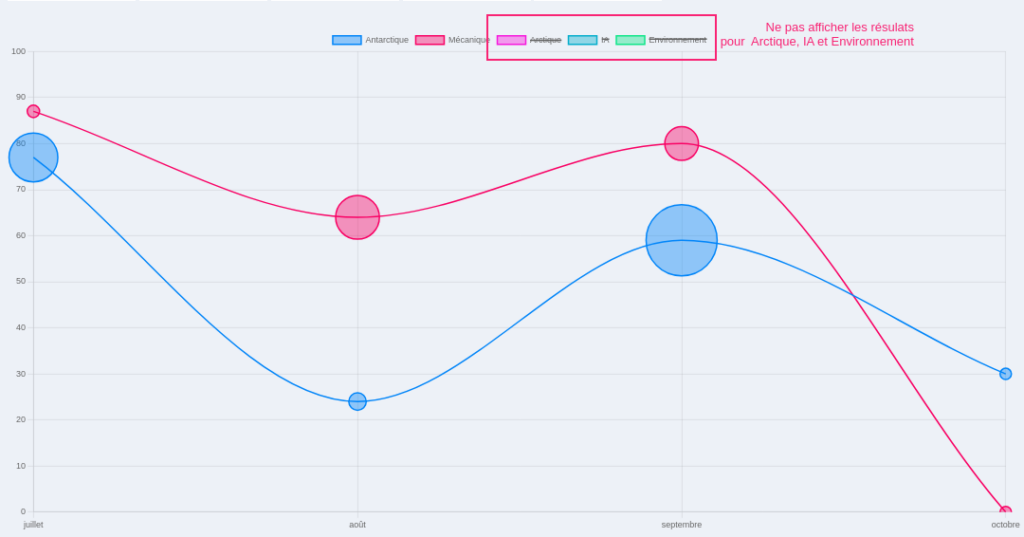
For each interval of the chosen period, a circle is represented with a diameter proportional to the number of tests taken. The position on the x-axis corresponds to the date of the interval, while the position on the y-axis represents the average scores obtained, on a scale from 0 to 100%.
Thus, you can visualize both the level of progression and the intensity of the activity.
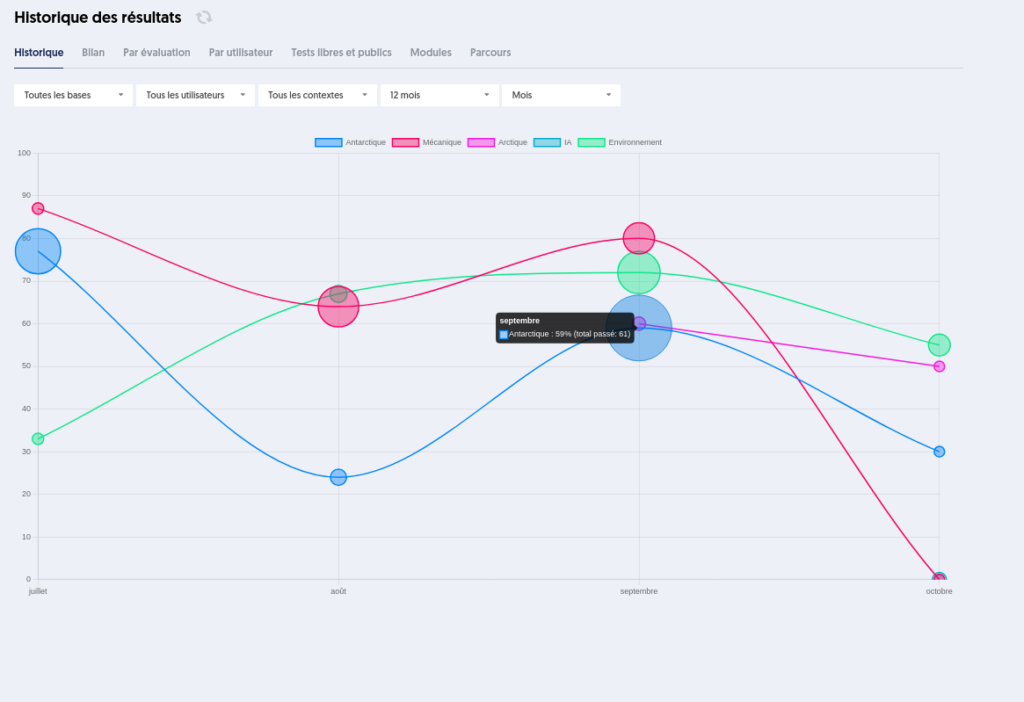
When hovering over the circle, a tooltip displays the period, the database, the average obtained, and the number of tests.
Note that the average displayed is the average of the averages of each user, meaning that each user has the same weight in this average, whether they have taken only one test or 25.
The legend at the top of the graph indicates the color of each database. By clicking on one of the databases in the legend, you can hide its curve, or conversely, make it appear.