Cycle Results
A summary of the results from a cycle is provided for both surveys and questionnaires conducted during the cycle.
It can be accessed on the cycle results page.

It is possible to filter the results by a group and by a period.

Summary on Questionnaire Steps
For questionnaire-type steps, a graph presents the results of the questionnaires conducted during the cycle.
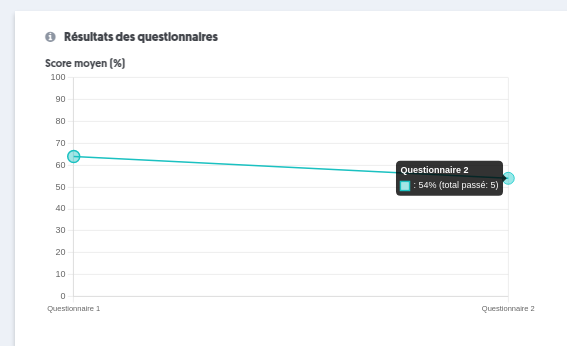
This curve considers only the steps of the cycle that are questionnaire-type.
- Score Evolution: It shows the progression of results over time.
- X-Axis: Displays the names of the steps in chronological order.
- Y-Axis: Represents the average scores obtained on the questionnaires when the step was completed.
- Point Diameter: Indicates the number of users who completed each step.
The data displayed takes into account the applied filters: user group and selected period.
This visualization allows analyzing both the progression of scores and the intensity of activity on the questionnaires throughout the cycle.
Summary on Survey Steps
Regarding the surveys, the analysis focuses on fields that have numerical values.
This curve considers only the steps of the cycle that are survey-type.
- Numerical Fields Considered: Only survey fields converted to numerical values are taken into account.
- Average Calculation: For each step, it calculates the average of the selected values across all these fields.
- Axes of the Curve:
- X-Axis: Displays the names of the steps in chronological order.
- Y-Axis: Represents the average scores obtained on all numerical fields that have a response.
- Point Diameter: Indicates the total number of responses used to calculate the average.
The data displayed takes into account the applied filters: user group and selected period.
This visualization allows analyzing both the evolution of scores and the intensity of activity on the surveys throughout the cycle.
Summary on Common Fields in Survey Steps
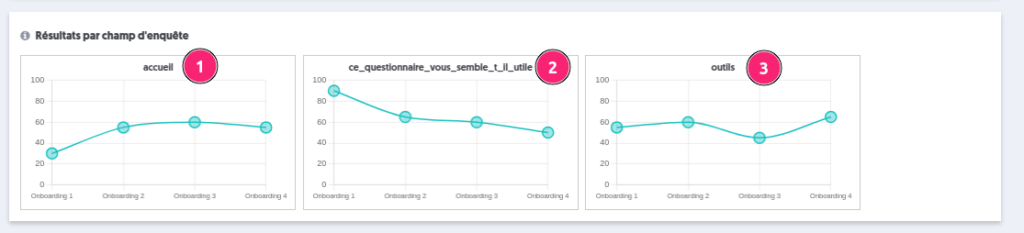
These curves represent the evolution of each common numerical field across different surveys. For example, if the field "welcome" is present in several steps of the cycle, a curve will illustrate the evolution of this field across those steps.
Numerical Fields Considered: Only survey fields converted to numerical values and common to various surveys are taken into account.
For each field:
- Average Calculation: For each step, the average of the chosen values for this field is calculated.
- Axes of the Curve:
- X-Axis: Displays the names of the steps in chronological order.
- Y-Axis: Represents the average scores obtained for the relevant numerical field.
- Point Diameter: Indicates the total number of responses used to calculate the average.
The data displayed takes into account the applied filters: user group and selected period. This visualization allows analyzing both the evolution of scores and the intensity of activity on the surveys throughout the cycle.
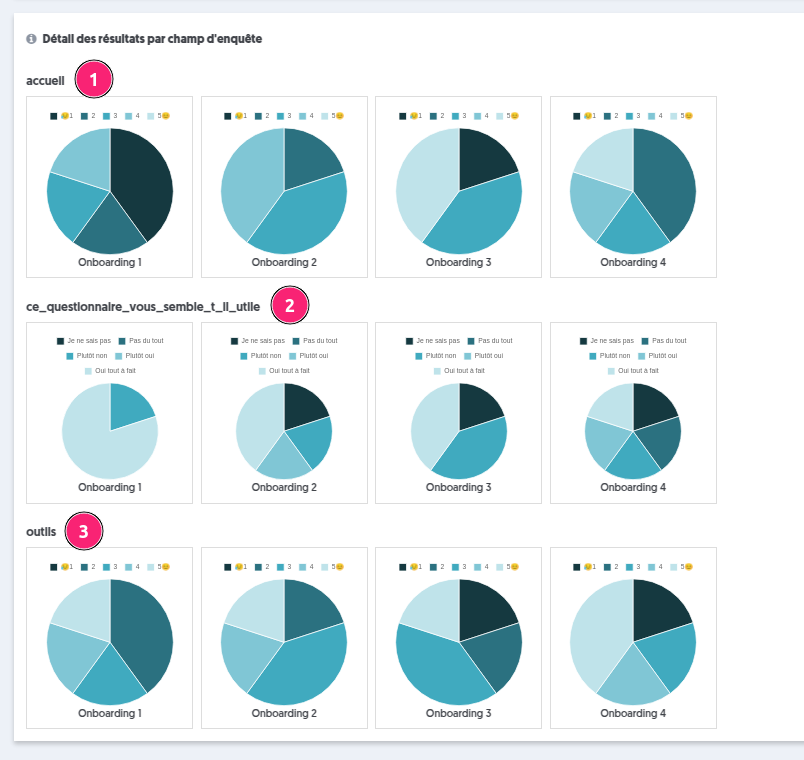
Summary on Values of Common Fields in Survey Steps
The charts of survey field values present, for each common numerical field, pie charts illustrating the distribution of selected values.
Each pie chart represents the values selected at each step, which allows for better understanding of the average obtained in the score charts of the survey fields.
This chart is also visible in the results of individual surveys:
- Welcome field
- Field this_questionnaire_seem_useful
- Tools field
Note that the title corresponds to the name of the field entered in the survey.