Progress Measurement
In the Training
Trainers can submit assessments throughout the training.
A good practice is to propose a diagnostic assessment in advance, followed by a summary at the end of the training.
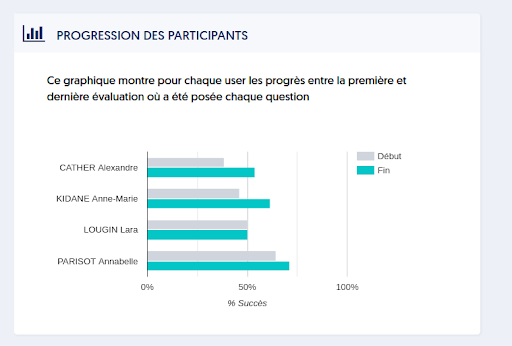
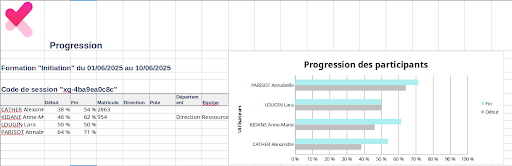
Experquiz allows you to measure progress based on all assessments taken during the training.
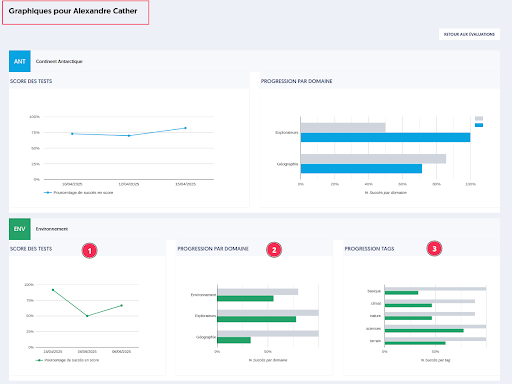
This progress is represented by an individual graph for each trainee.
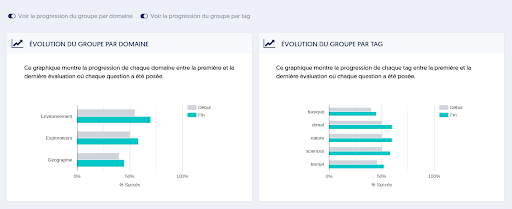
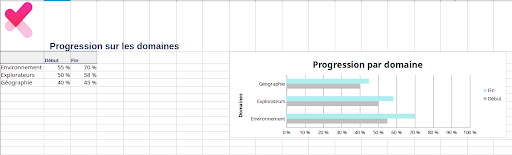
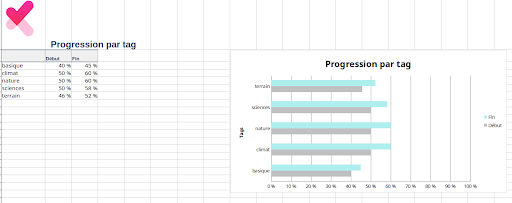
If the thematic base includes sub-themes (areas) or tags, two curves can visualize the group's progress on each of these subparts.
These numerical and graphical results can be exported in Excel format.
In a User's Results
Experquiz offers a summary of activities by user. To access it, go to the users list, then click either on the user's name [1] or on the button representing a curve [2].

Several tabs display the results, training sessions, pathways... up to the user's audit log.
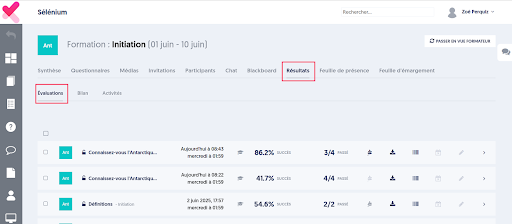
In the Evaluations sub-tab of the Results tab, you can filter the list of assessments [1] according to various criteria (bases, contexts, periods, etc.).
Next, simply select the desired assessments [2], and then click the “Progress” button [3] to display the progress visualization page.
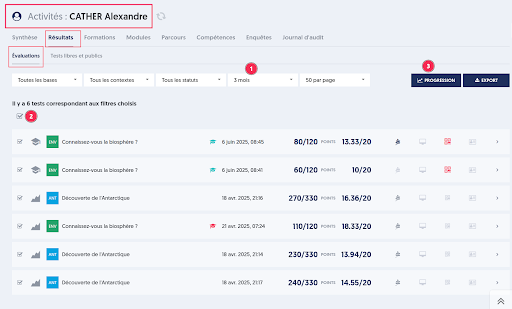
This progress page presents:
- A graph of the scores obtained for the selected assessments
- A before/after progress by domain, if the thematic base contains them
- A before/after progress by tag, if the thematic base contains them