Evaluation Results
When a questionnaire is offered to a list of participants, Experquiz provides a rich multidimensional analysis. It allows for quick visualization of results through various interpretation axes and multiple levels of precision: from the overall score down to the details of the responses given, including response time.
General Tab
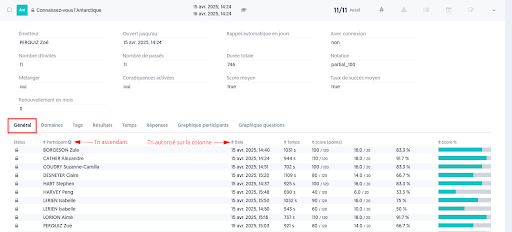
The “Participant,” “Date,” “Time,” and “Score” columns can be sorted (↕)
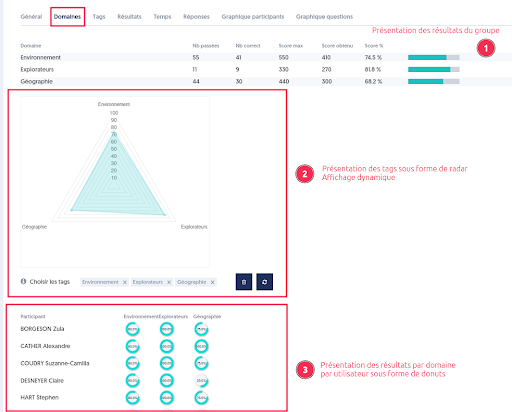
Domains Tab
Results by domain are presented:
- For the group in the form of a gauge
- For the group in the form of a dynamically adaptable radar
- By participant in the form of a donut (arc)
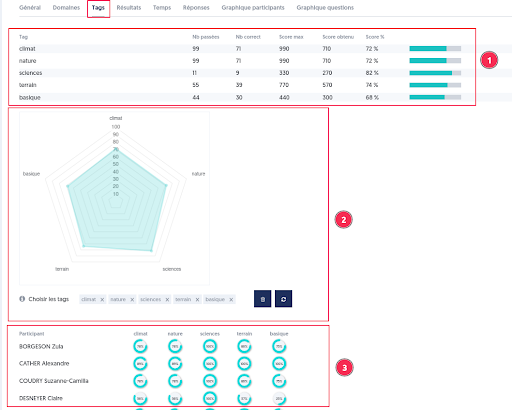
Tags Tab
Results by tag are presented:
- For the group of participants in the form of a gauge
- For the group in the form of a dynamically adaptable radar
- By participant in the form of a donut
Results, Time, and Responses Tabs
These three tabs present results by question and by user.
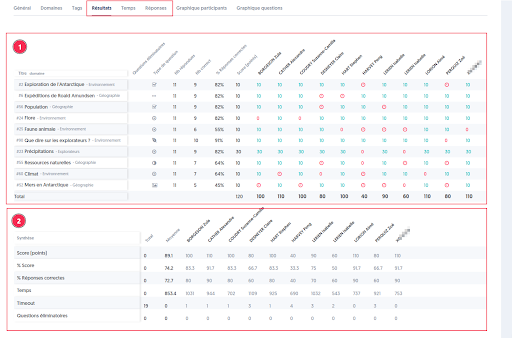
Results present:
- A first table to display the score achieved, the time, or the response per question and per user
- A summary table that shows the score, time, and the number of errors on elimination questions by user
Participant Graph Tab
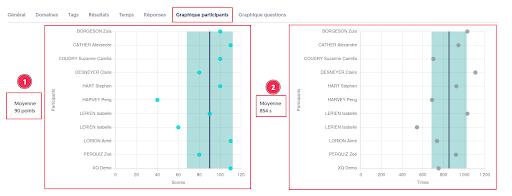
Two graphs present:
- The score positioning of participants relative to the average (navy blue line) and standard deviation (turquoise band)
- The time positioning of participants relative to the average (navy blue line) and standard deviation (turquoise band)
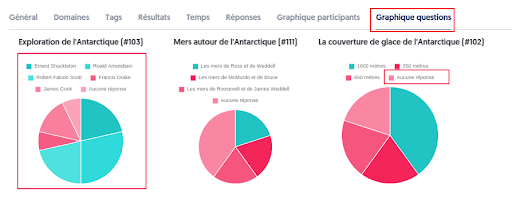
Questions Graph Tab
This tab presents the distribution of responses given by question. A category “no response” has been added. These graphs are particularly important for seeing which questions pose difficulties and which concepts need to be revisited.
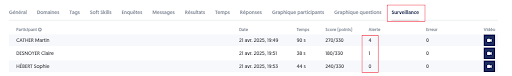
Monitoring Tab
This tab is only present in the case of exam monitoring.
It presents, for each participant, the results in terms of score, time spent, and alerts. Alerts correspond to monitoring events that may indicate an attempt at cheating (e.g., exiting full screen, changing window, etc.).
Soft Skills Tab
It displays the results of the analysis of questions related to soft skills:
- A group view, in the form of a radar.
- An individual view for each participant.
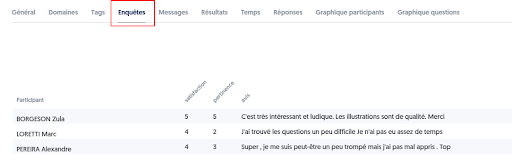
Survey Tab
It is possible to propose a survey before the questionnaire begins or after its completion (just before displaying the score page).
The collected responses are then presented in this tab.
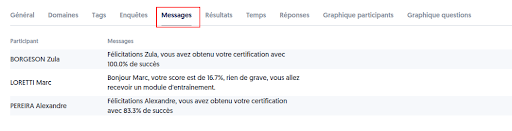
Messages Tab
It is possible to propose a survey before the questionnaire begins or after its completion (just before displaying the score page).
The collected responses are then presented in this tab.
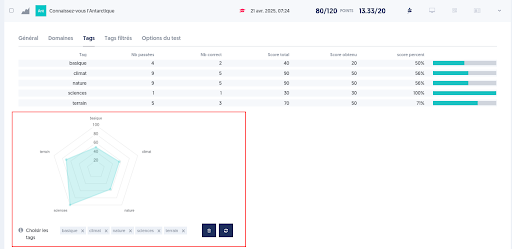
Dynamically Reconfigurable Radar
Individual tests also present results in the form of dynamically adjustable radars, meaning that it is possible to select the tags to be represented on the graph.